Growth stock valuations have declined considerably over the past year, with small growth stocks seeing significant multiple compression. How do these valuations compare to history and what might they imply going forward?
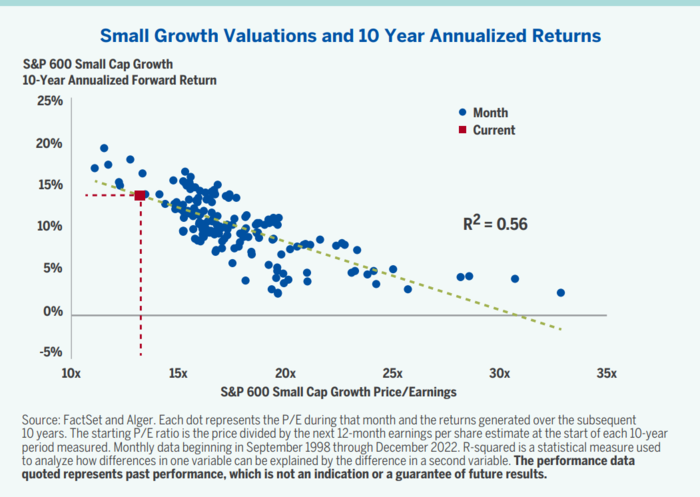
- The price-to-earnings (P/E) multiple of the S&P 600 SmallCap Growth index was one of the lowest that we have observed at the end of December 2022.
- As the chart above suggests, there is a strong historical relationship between P/E and subsequent annualized returns. Historically, below-average P/E multiples in small cap growth, which we observe currently, have led to above-average returns.
- We’ve also observed that small growth (S&P 600 SmallCap Growth) appears attractive on a relative basis to the S&P 500 (more than a 17% discount based on price-to-next 12 months consensus EPS estimates as of the end of December 2022). As a result, we believe that U.S. small cap growth may be an attractive area of the stock market for long-term investors.
Download the PDF